

Game theory and the art of litigation settlement (Part 2)
This article is the second in a series targeted at litigators that consider the issue of settlement in litigation through a game theoretical lens.
Article 2 - Settlement where the parties disagree on the case merits and 'what if?' analysis
Impact of disagreement on the merits of the case
In the previous article in this series we considered a hypothetical claim where the claimant and defendant were both in agreement that the claimant had a 50% chance of success. In reality it is quite unusual that that the parties would share the same view on its merits – certainly not at the outset. In this article we will examine the impact on settlement prospects of the parties holding divergent views on the merits of the case.
First, we begin by quickly revisiting the settlement graph produced for the 50:50 case in the first article where the claim value was £1 million and where both parties expect their legal costs to be approximately £300k. One can see that although the settlement acceptance zone narrows as the parties incur costs, it still persists until trial.
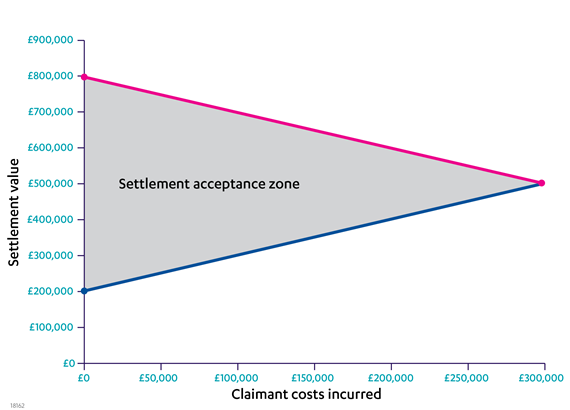
Figure 1 - Settlement graph produced for the 50:50 case where both parties believe they have a 50% chance of being successful at trial (assuming a claim value of £1 million and both parties have expected legal costs of approximately £300k to trial)
Up to now we have not considered the costs that either the claimant and or defendant could potentially recover from the other in the analysis beyond noting that recovery payments will (on average) cancel each other out in situations where both parties agree the prospects of success are 50:50 and anticipated legal spends are the same. As we will deviate from the first assumption in the examples that follow cost recovery can no longer be discounted. In the interests of keeping this article concise, cost recovery payments have been factored into the diagrammatic examples that follow but their workings are not generally set out explicitly.With that clarification, we now consider the position if the claimant was more optimistic of its chances of success than in the previous example and believes it would have a 60% chance of winning at trial. We will also assume that the defendant is also more confident of its' own chances and believes that the claimant only has a 40% chance of winning at trial.
With these new assumptions we can plot a new settlement graph, which is shown below.
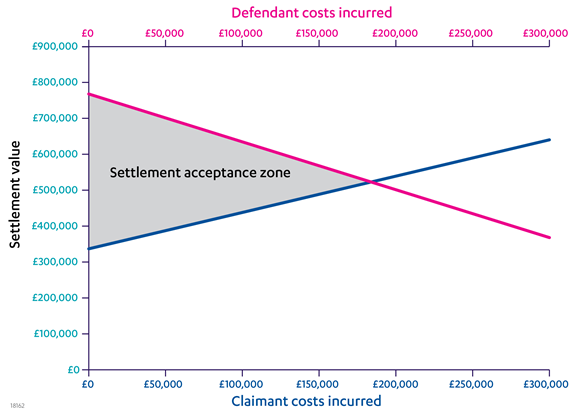
Figure 2 - Settlement graph produced where the claimant and defendant each believe they have a 60% chance of success at trial (assuming a claim value of £1 million and where both parties have expected legal costs of approximately £300k). 1
We can immediately see that the size of the settlement acceptance zone has decreased considerably. We can also observe that past a certain costs threshold (roughly mid-way through the case) there is no settlement acceptance zone. The absence of a settlement acceptance zone does not mean the case cannot be settled but settlement is much less likely as both parties believe that (on average) they would do better at trial than the range of outcomes acceptable to their opponent. This means that in the scenario above there is an early window of opportunity to settle the case which gradually closes and ultimately disappears as the case progresses.
What is interesting about this new scenario (while the settlement acceptance zone exists) is that neither party actually needs to convince the other that their view of the merits of the case is the correct one in order for the case to be settled. The size of the potential legal cost savings that can be made is sufficient to allow both parties (in their own eyes) to achieve a more favourable settlement than they believe they would get (on average) at court. This also holds true (initially) even if we increase the claimant's and defendant's assessment of the claimant's success prospects to 70% and 30% respectively, as is shown in the graph below.
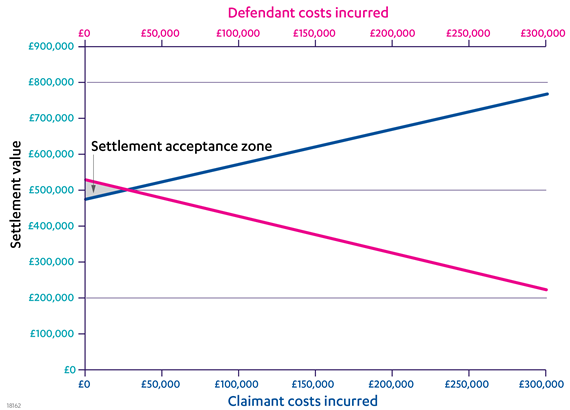
Figure 3 - Settlement graph produced where the claimant and defendant each believe they have a 70% chance of success at trial (assuming a claim value of £1 million and where both parties have expected legal costs of approximately £300k). 2
In each case the mid-point of £500k between the claimant's and defendant's indifference lines remains unchanged because their respective indifference lines have risen/fallen by the same amount as they are both equally more optimistic of their own success prospects.
Impact of incurring costs
We are going to take a closer look at the settlement acceptance zone in the 70:30 case above but we will assume that the claimant has incurred £30k worth of costs since the start of the case. The graph below zooms into the settlement acceptance zone on the previous graph with this new assumption so we can see it in more detail.
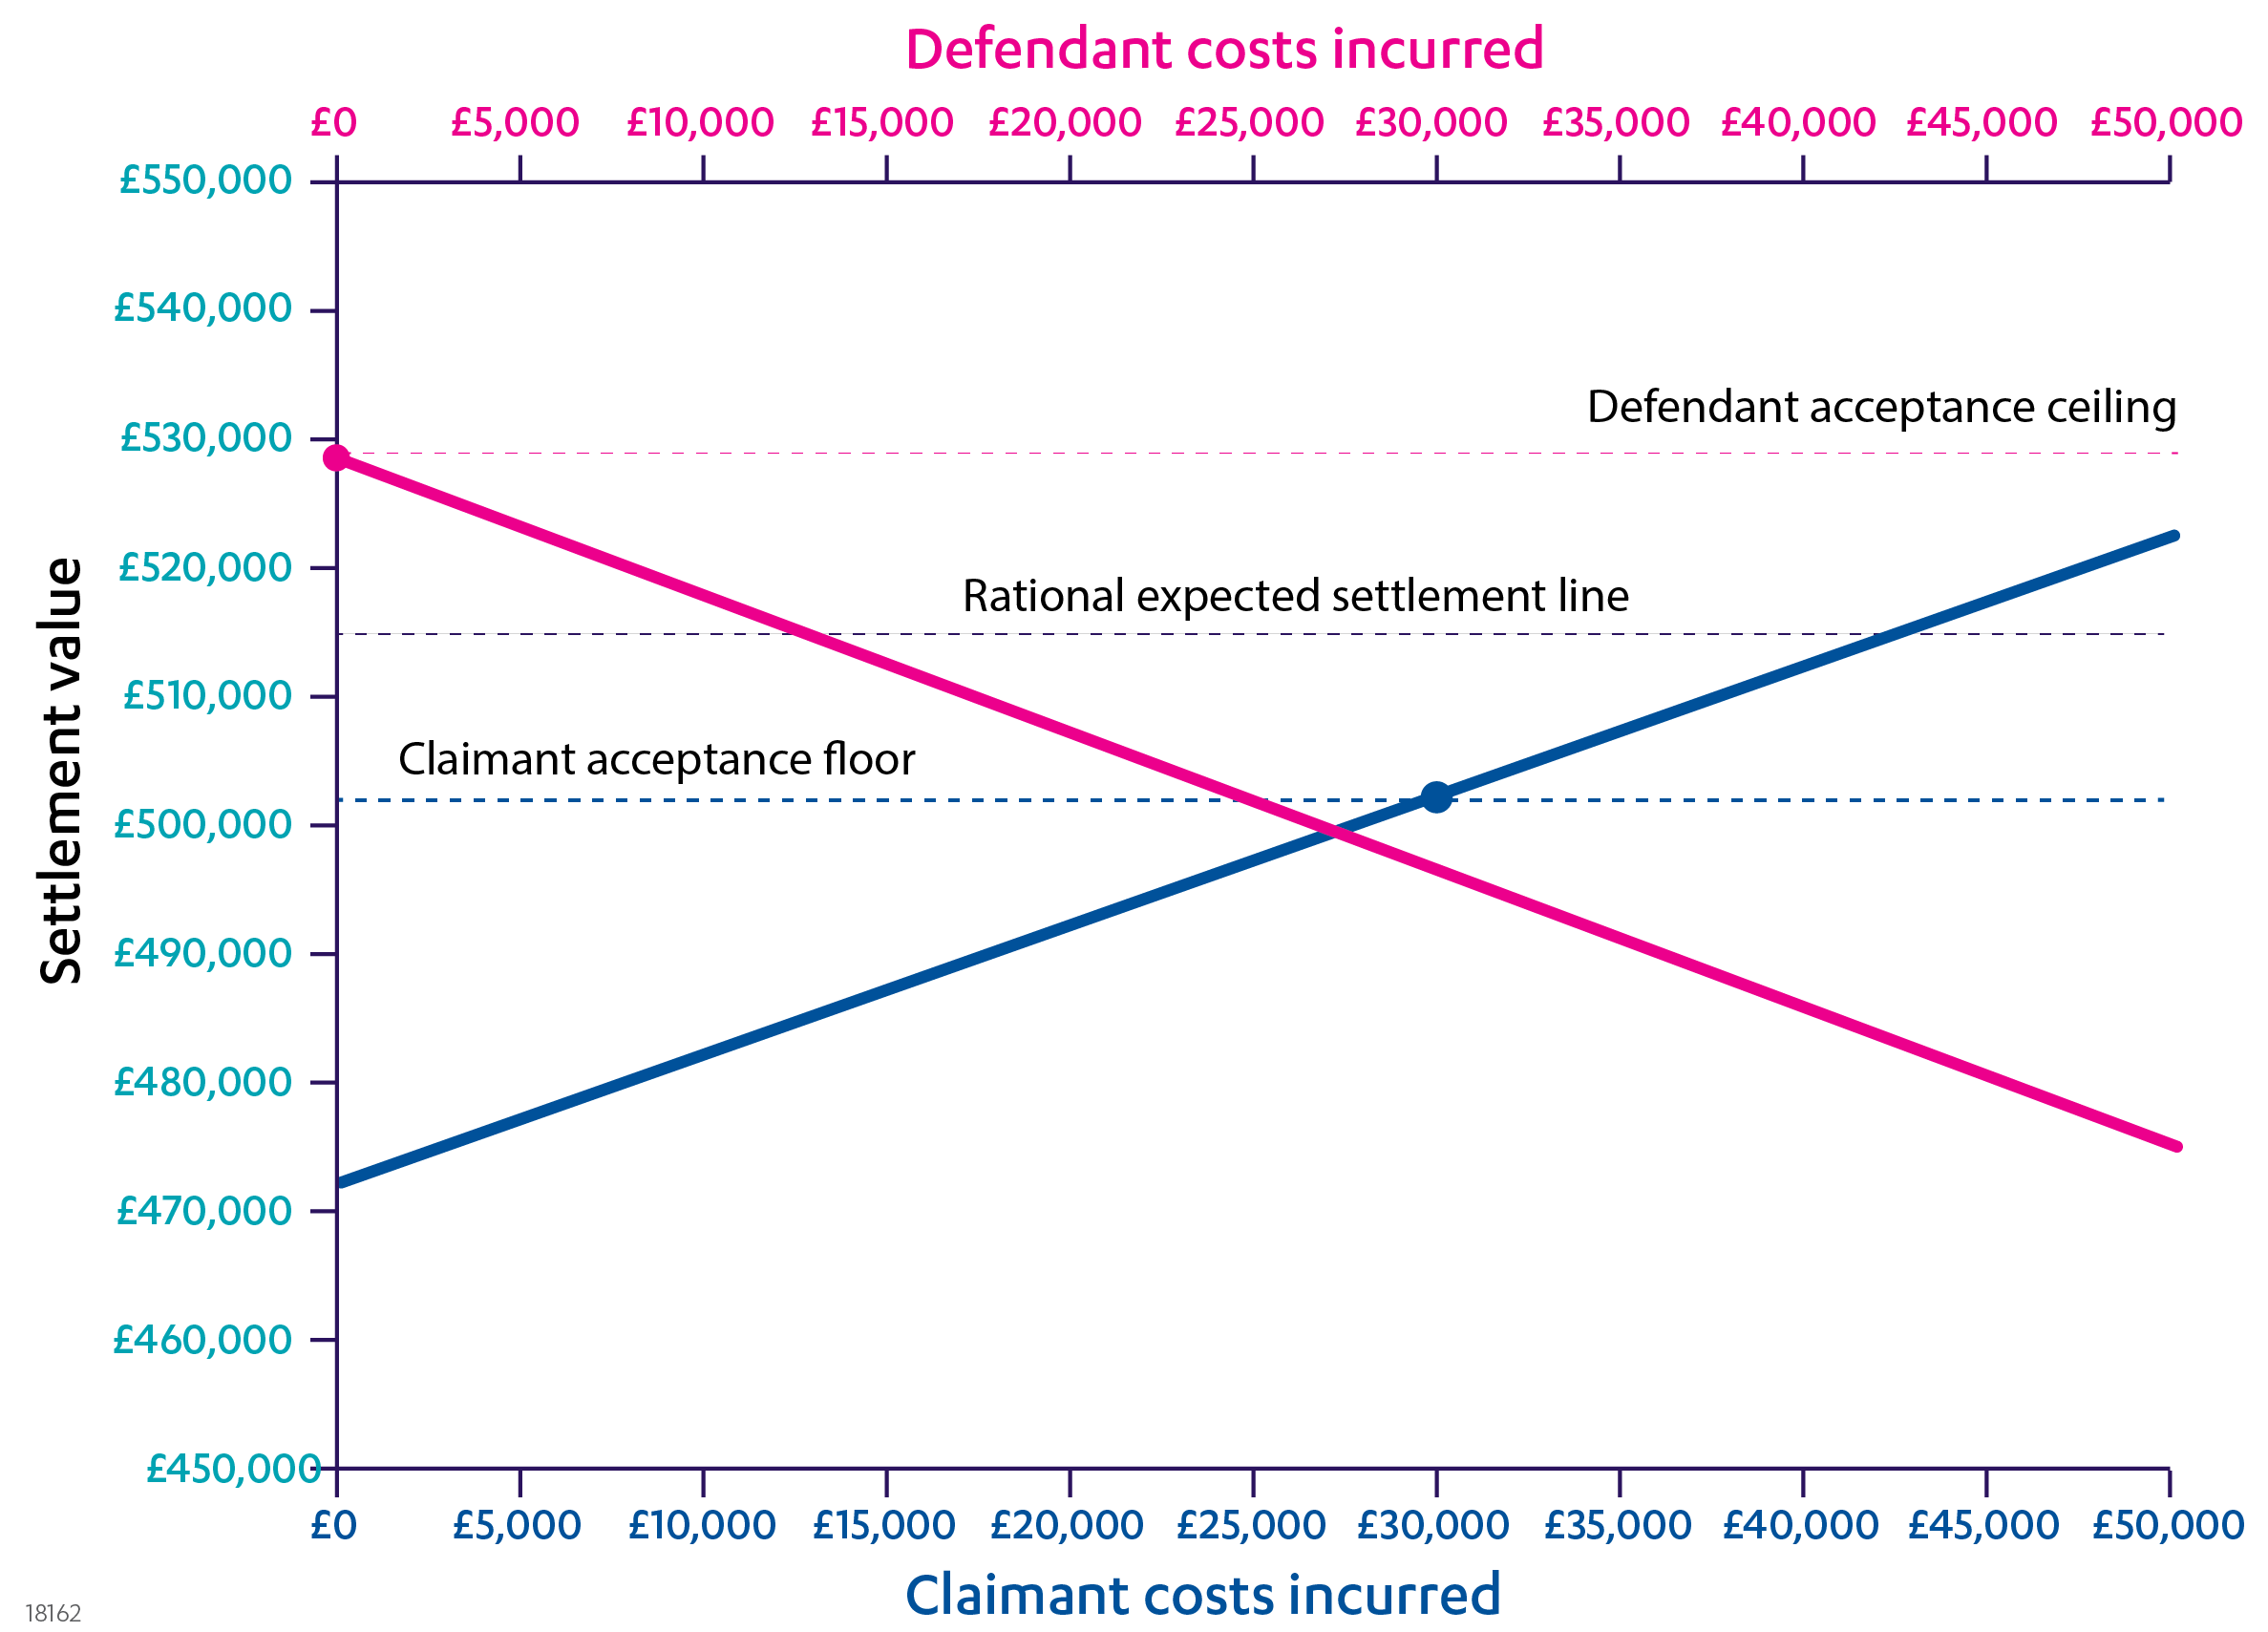
Figure 4 - Settlement graph produced where the claimant and defendant each believe they have a 70% chance of success at trial assuming the claimant has incurred £30k in costs (assuming a claim value of £1 million and where both parties have expected legal costs of approximately £300k to trial)
The costs incurred by the claimant and defendant have been marked by coloured dots along their indifference lines and a horizontal blue and pink dotted lines have also been added to show the value the claimant or defendant would be indifferent to settling at relative to proceeding to trial at their current level of costs. We can refer to these lines as the 'claimant acceptance floor' and 'defendant acceptance ceiling' respectively. The point equidistant between the 'floor' and 'ceiling' is the settlement value at which we might expect the claimant and defendant to agree (assuming equal bargaining position strength and attitude to risk). We will refer to this as the 'rational expected settlement line' – which is shown as a grey dotted line in the graph.
Interestingly, the impact of the claimant having incurred £30k in costs has increased the rational expected settlement line (which was £500k) by £15k to £515k. 3
If we consider the overall recovery position for both parties we can see that the negative impact on the parties' positions of the claimant's expenditure is equally distributed. The claimant has spent £30k but as the expected settlement level has increased by £15k its expected recovery position has fallen in aggregate by only £15k. From the defendant's perspective the expected settlement level has increased by £15k so its' expected liability position has increased by that amount. Overall, the claimant's position is likely to be have been strengthened by this turn of events because although the negative impact on settlement positions has been shared, the (unquantified) beneficial aspects of the underlying work carried out is likely to have solely benefitted the claimant.
Of course in our scenario the defendant could spend a similar amount itself and return the position to equilibrium. However, were it to do so would take the claim outside of the settlement acceptance zone (see Figure 3) – which rationally is a less desirable position to be in then than having settled in the settlement acceptance zone. This sets up an interesting tactical dilemma for the defendant as the spending constraint places it at a tactical disadvantage. The lesson that emerges is that if there is no immediate prospect of settlement then it is advantageous for a party to incur costs earlier than its opponent if it can be said to advance its position.
'What if?' analysis
The fact two parties are in a settlement acceptance zone does not necessarily mean that either party should immediately settle. Before considering whether to make (or accept) a settlement offer a party should consider whether spending money on an activity could impact the settlement landscape to its benefit.
To illustrate this let us return to our original 50:50 scenario (that is both parties hold the same view that the claimant's chances of success are 50%) and assume both parties have spent £50,000 each to date. On those assumptions the settlement graph is as below.
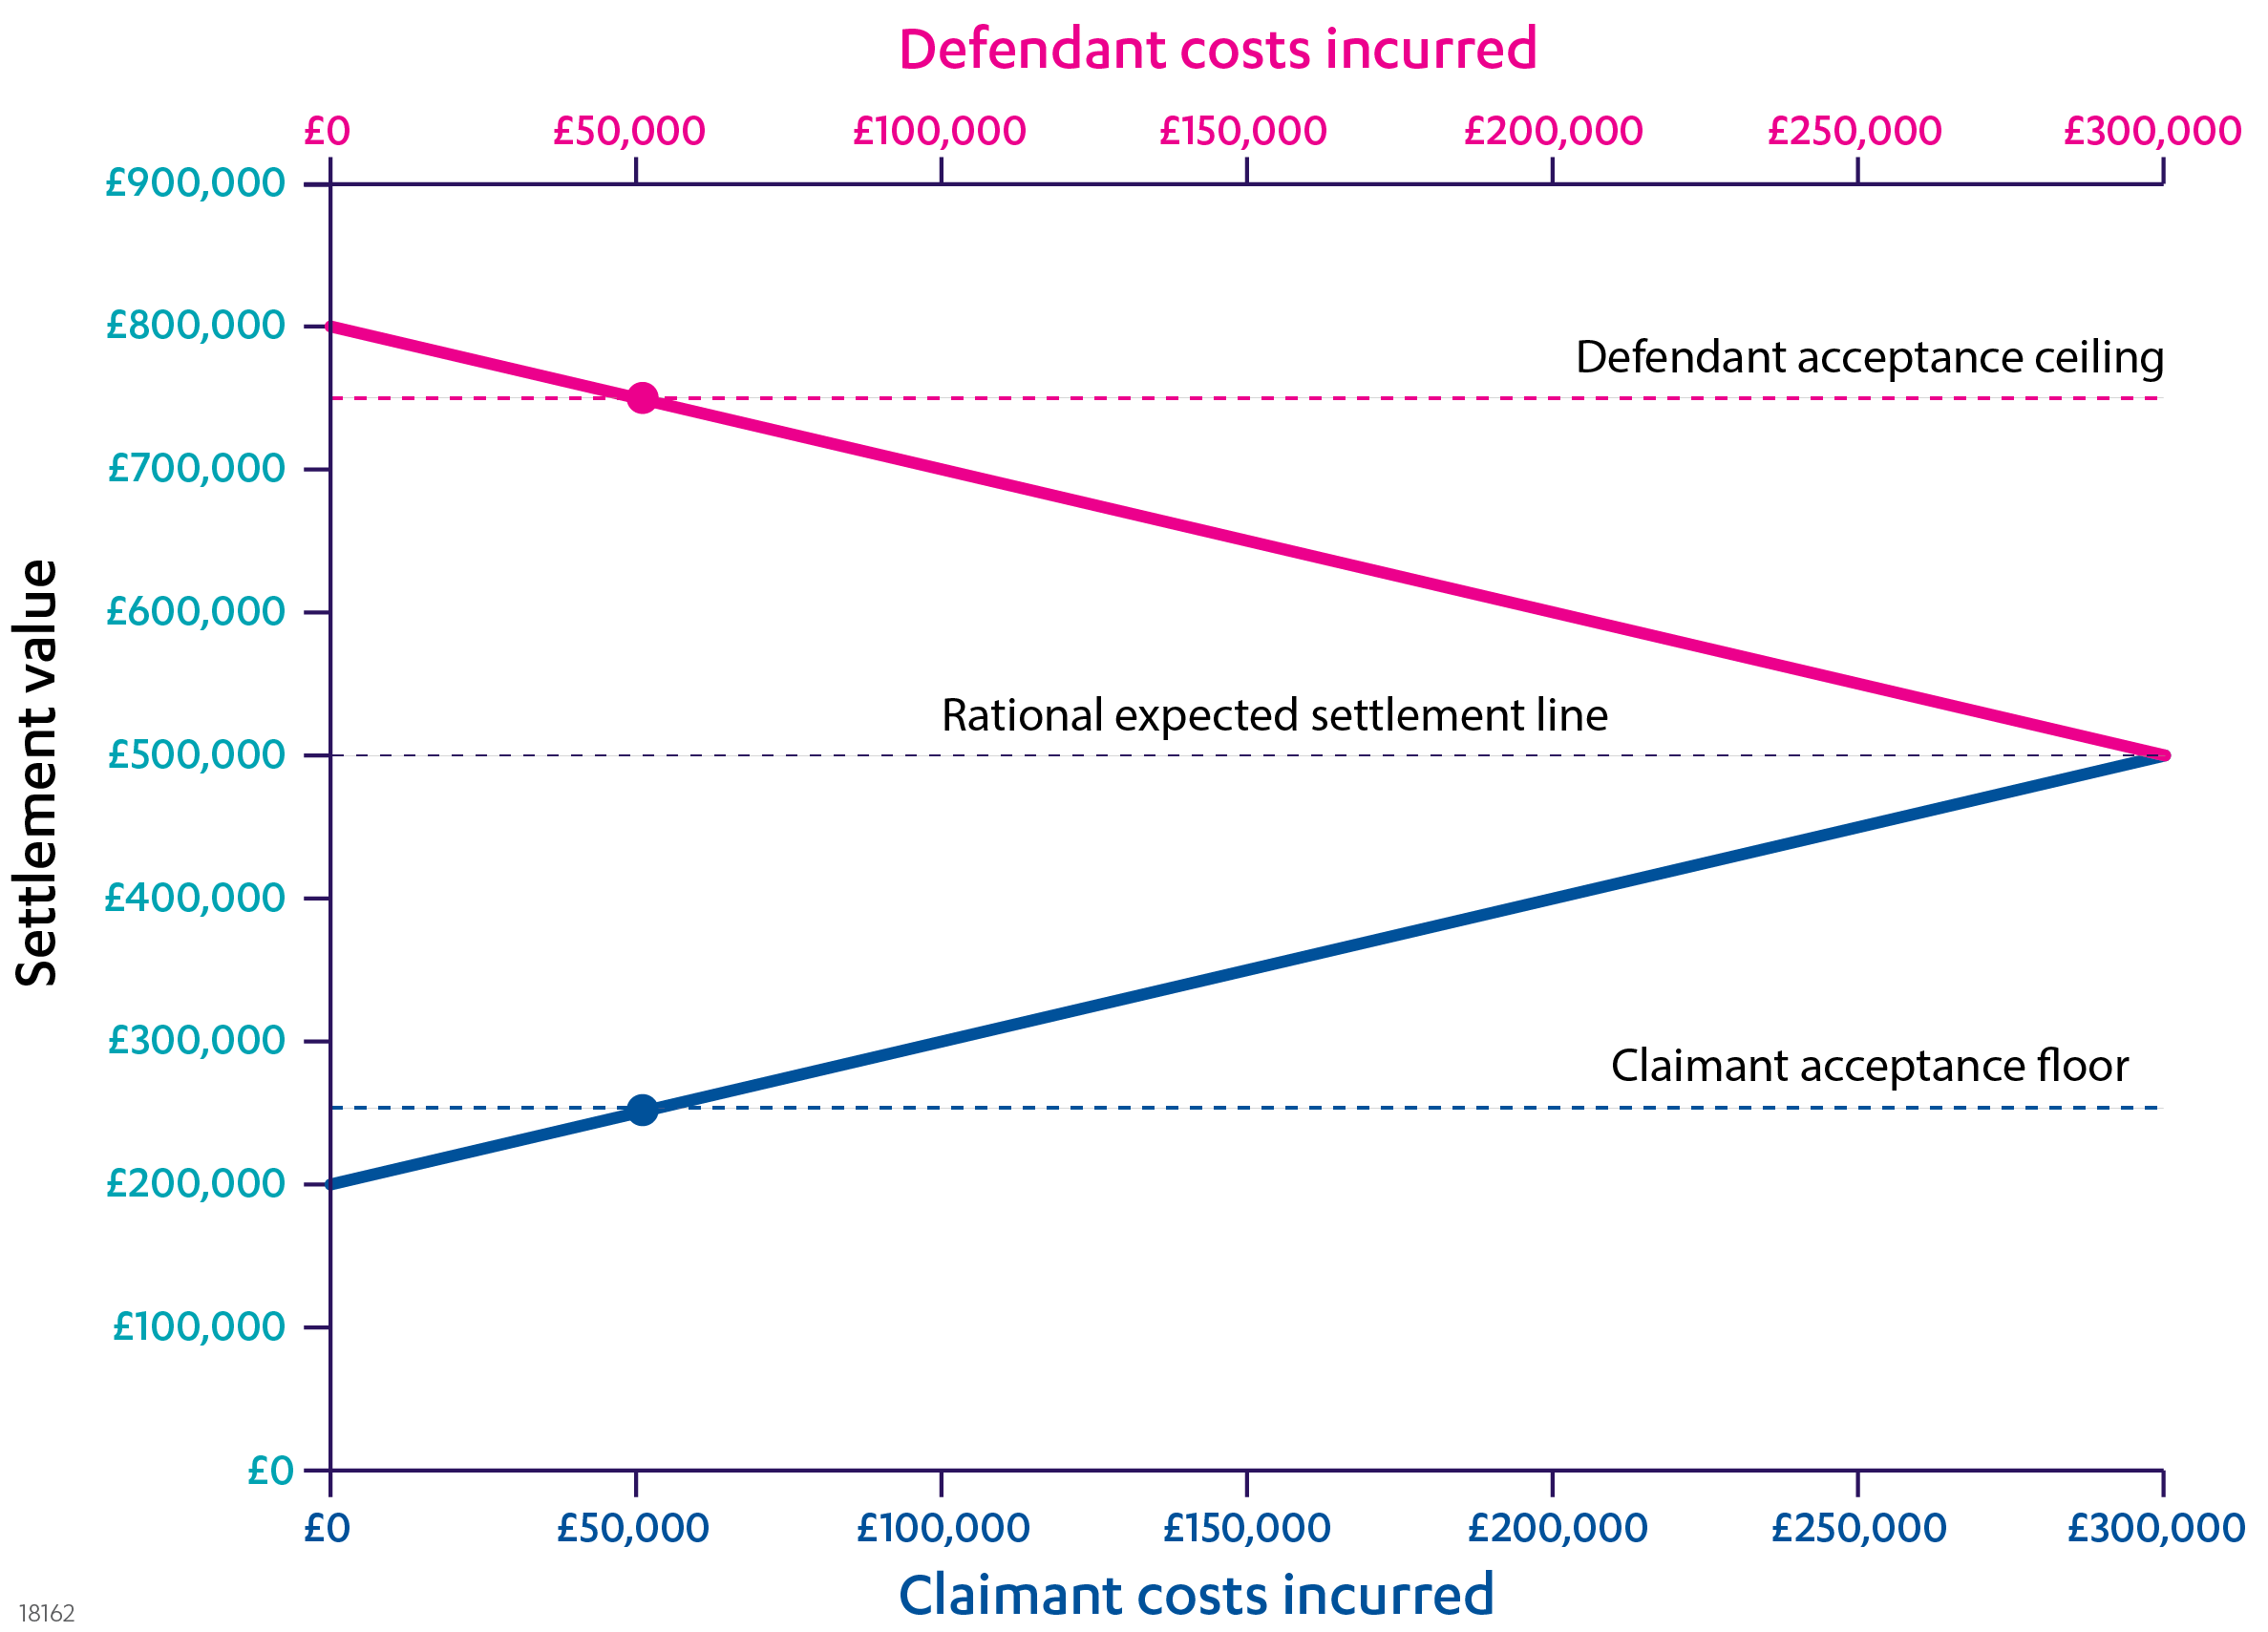
Figure 5 - Settlement graph produced for the 50:50 case where both parties believe they have a 50% chance of being successful at trial but where both parties have incurred £50k in costs (assuming a claim value of £1 million and where both parties have expected legal costs of approximately £300k to trial)
Both parties could agree to settle the case at the rational expected settlement line for £500k and both save £250k each on legal fees going to trial. In this scenario the claimant's recovery is £450k (i.e. £500k settlement minus £50k legal spend). However, let us assume that the claimant suspects that the parties both carrying out disclosure might improve its position. For both parties to do so would cost each of them an extra £100k. Let us assume that the claimant thinks that in the worst case disclosure would have a neutral impact on the case merits but in the best case it would increase both parties' view of the claimant's success prospects to 60%. We will also assume that the claimant thinks that either outcome is equally as likely. Should the claimant go ahead?
The answer is no. We can compare the two possible outcomes below – the graph on the top shows the neutral outcome and the graph on the bottom the 'good' outcome (for the claimant).
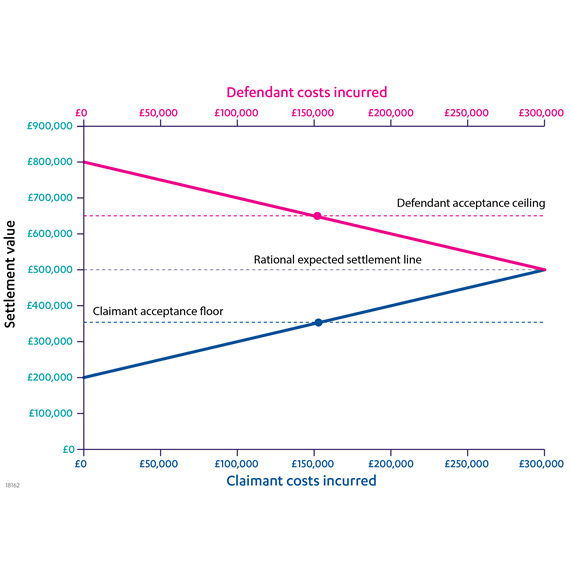
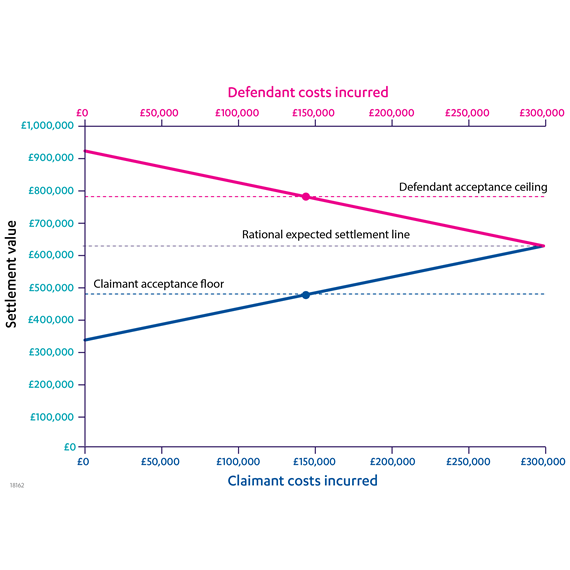
Figure 6 – The settlement position shown in Figure 5 following a hypothetical disclosure exercise costing each party £100k. The top graph shows the position if the exercise had no material impact on the parties' view of success prospects and the bottom graph shows the position if the exercise resulted in both parties revising their estimate of the claimant's likelihood of success to 60%.
In the neutral outcome (the top graph) the rational expected settlement line remains the same (at £500k). In other words, post disclosure one would expect the parties to settle at the same amount. Were they to do so the overall recovery for the claimant would be £350k (i.e. £500k settlement minus £150k legal fees).
In the 'good' outcome (from the claimant's perspective – i.e. the bottom graph of Figure 6) the rational expected settlement line has increased to £636,000. This means that the overall recovery for the claimant is £486k (i.e. the £636k settlement minus £150k legal fees).
We can obtain the overall outcome by summing over the probabilities (as covered in the previous article in this series), by doing so we get a net recovery figure of £418,000 (i.e. 50% of £350k + 50% of £636k). As £418k is less than the £450k net recovery outcome of not carrying out the disclosure exercise we can see that (on average) the proposed disclosure exercise would not be advantageous for the claimant.
However, that is not necessarily the end of the story. From the defendant's perspective (assuming it agrees with the claimant's assessment of likely outcomes of the disclosure exercise) the position is even worse. If one runs the numbers, the defendant (on average) ends up being £168k worse off as a result of the exercise, considerably more the claimant's (average) loss of £32k. That means that the claimant could use the threat of the disclosure exercise to negotiate a higher settlement amount from the defendant. The fact that the potential damage to the defendant is much greater than to the claimant makes the threat credible even though it is not actually in the claimant's interest for the exercise to go ahead.
Summary
We have seen that it is possible for the settlement acceptance zone to disappear before the conclusion of a case. Identifying the window during which the case is settle-able can be essential to obtaining an outcome that is in the eyes of both parties superior to a court award. We have also seen that, situationally, incurring costs earlier than one's opponent can be tactically advantageous.
We have also considered how a quantitative 'what if?' analysis can be used to assess whether a particular action is beneficial to a party based on a particular set of assumptions. Finally we have also seen that even if an activity is on balance detrimental to both parties if it is on balance more detrimental to one than the other this can potentially be leveraged to negotiate a more favourable settlement.
In the final article in the series we will be looking at how part 36 offers can impact a case's settlement position.
1 In this example the claimant's expected recovery at trial is £636,000 (which is the position of the claimant indifference line at costs of £300k to trial). This is based on a 60% chance of winning at trial and receiving £1m plus £180k in costs + a 40% chance of losing at trial and paying £180k to the defendant. Similarly the defendant's expected loss at trial is £364k. This is based on a 40% chance of losing at trial and paying £1m plus £180k in costs + a 60% chance of winning at trial and being awarded £180k in costs.
2 In this example the claimant's expected recovery at trial is £772k (which is the position of the claimant indifference line at costs of £300k to trial). This is based on a 70% chance of winning at trial and receiving £1m plus £180k in costs + a 30% chance of losing at trial and paying £180k in costs to the defendant. Similarly the defendant's expected loss at trial is £228k. This is based on a 30% chance of losing at trial and paying £1m plus £180k in costs + a 70% chance of winning at trial and being awarded £180k in costs.
3 This new rational expected settlement value is calculated by taking the midpoint between the claimant's rational floor and defendant's rational ceiling. These floor/ceiling values are calculated by taking each party's expected recovery/loss at trial (see footnote 2 for that calculation) and adding/subtracting respectively their future costs. Therefore the claimant's rational floor is £502k (i.e. expected recovery at trial of £772k minus future costs to trial of £270k) and for the defendant's rational ceiling is £528k (expected loss at trial of £228k plus future costs to trial of £300k). The expected settlement line is therefore the midpoint between £502k and £528k, i.e. £515k.